Is the Farm in Profit or in the Red: How to Count Profit per Head and Where the Money Goes
Profit per head = income per head minus cost per head. A worked example for a 100-head farm at August 2026 prices: income, expenses by category, the cost structure and a check on whether the feed pays off, measured through weight gain.
A farm's profit is calculated over a period: income minus expenses for the same month, quarter or year. Profit per head is that difference divided by the headcount. One good sale before Kurban Hayit doesn't answer the real question — whether the farm is making money or eating itself alive: money comes in all at once, but it goes out every day, and you only see the difference over a longer stretch.
Below is a calculation for a 100-head farm at August 2026 prices, a breakdown of expenses, and a check of whether feed is paying for itself. The exchange rate used for conversion is 11,950 sum per dollar (the Central Bank of Uzbekistan's rate on August 13, 2026 was 11,948.58).
Which numbers tell you whether the farm is making money
Five numbers are enough. Everything else is just detail.
| Metric | How it's calculated | What it tells you |
|---|---|---|
| Income for the period | all receipts: livestock, wool, young stock | the scale of the farm |
| Expenses for the period | feed, vet care, labor, buying animals, other | how much it costs to keep the flock |
| Cost per head | expenses ÷ headcount | how much one animal costs to keep |
| Income per head | income ÷ headcount | how much one animal brings in |
| Profit per head | income per head − cost per head | whether the farm is making money or not |
The key pair is the last two rows. As long as income per head is higher than cost per head, the flock is working for you. The moment it drops below, every head in the pen is costing you money — and the more of them there are, the faster your profit disappears.
Why a farm looks more profitable "by eye" than it really is
The mistake is almost always the same: you remember all of the income, but only part of the expenses.
A sale stands out; feed is smeared across the days. One and a half million sum for a ram sticks in your memory. Two thousand sum a day per head doesn't — even though over a year that's 730 thousand sum from that same head.
Unproductive animals don't get subtracted. A barren ewe eats as much as a pregnant one. Ten barren ewes in a 100-head flock eat about 7 mln sum (≈ $586) worth of feed over a year and produce not a single lamb.
Losses don't get translated into money. Five dead lambs at 40 kg each mean 11.4 mln sum (≈ $955) in revenue you never collected, at 57,000 sum per kilogram of live weight. In the example below, that's half the farm's annual profit.
Your own labor and your own hay get treated as free. That's how you end up with "the farm feeds us" — it feeds you exactly as much as you're not paying yourself a wage.
You count by the deal, not by the period. Sold for more than you paid — so you made money, right? Between the purchase and the sale there were six months of feeding, treatment and work, and none of that is in this arithmetic.
What a flock of 100 head actually earns
The farm: 100 head, 60 of them ewes, the rest young stock and breeding rams. We're calculating a calendar year.
Income
| Item | Calculation | Amount |
|---|---|---|
| Sale of young stock | 45 head × 48 kg × 57,000 sum/kg | 123.1 mln sum |
| Culled ewes | 9 head × 55 kg × 45,000 sum/kg | 22.3 mln sum |
| Wool | 180 kg × 2,500 sum/kg | 0.45 mln sum |
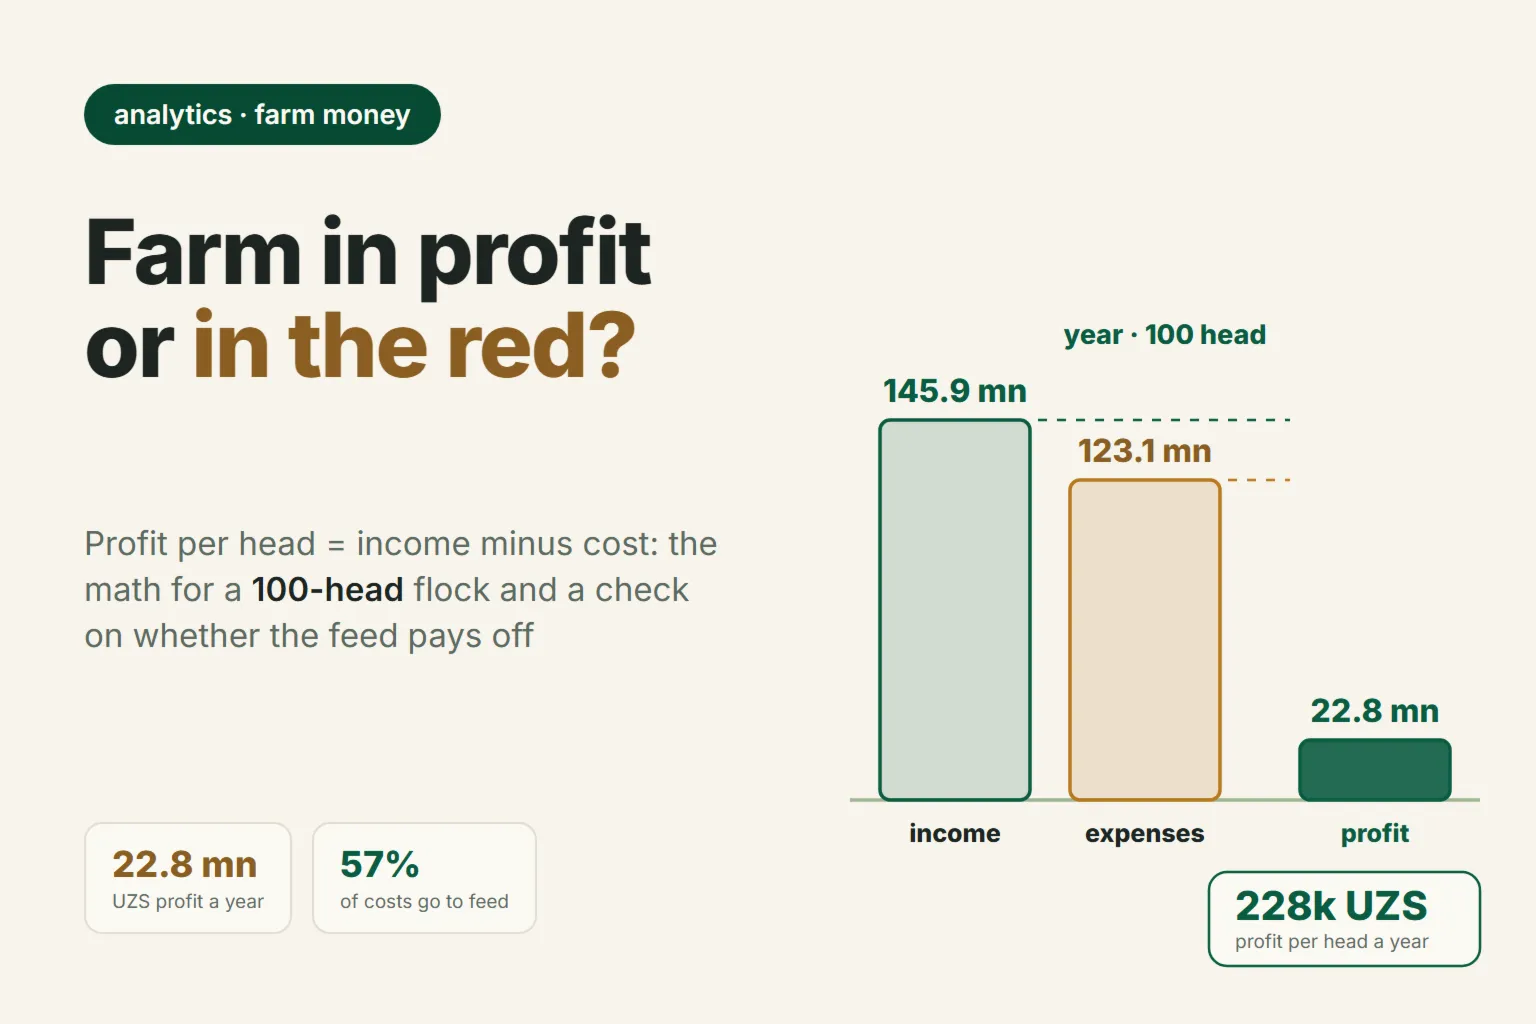
| Total | 145.9 mln sum (≈ $12,200) |
The wool line here is symbolic, and that's not a mistake in the math: unwashed coarse fleece sells for next to nothing, and shearing often costs more than the wool brings in. We covered this in detail in our article on the economics of wool.
Expenses
| Item | Calculation | Amount |
|---|---|---|
| Feed | 100 head × 700 thousand sum a year | 70.0 mln sum |
| Shepherd's pay | 2.8 mln sum × 12 months | 33.6 mln sum |
| Buying animals | breeding ram | 6.5 mln sum |
| Vet care and medicine | 100 head × 65 thousand sum | 6.5 mln sum |
| Other: transport, water, tags, shed repairs | 6.5 mln sum | |
| Total | 123.1 mln sum (≈ $10,300) |
Adding it up:
- annual profit — 22.8 mln sum (≈ $1,910);
- cost per head — 1.23 mln sum (≈ $103);
- income per head — 1.46 mln sum (≈ $122);
- profit per head — 228 thousand sum (≈ $19) a year.
The number is sobering, and it's honest: 100 head with a hired shepherd earn less than it looks like from the outside. Notice where the bulk of the money is hiding — in labor. If you or your family do the shepherding yourselves, that 33.6 mln sum line disappears from expenses and profit jumps to 56.4 mln sum (≈ $4,720) — 4.7 mln a month. That's not "the farm earns twice as much" — it's your own wage that you never paid yourself. Compare it to the 2.8 mln a hired shepherd works for: on top of that rate, the farm gives you about 1.9 mln sum a month. That's the actual profit of the business — everything else is payment for your own labor.
All the figures in these tables are a reference point, not a norm: the shepherd's rate in your district and your feed prices are your own — plug them in. The feed calculation is averaged: winter hay with barley, pasture supplementing, and fattening young stock before sale. If you have your own pasture and your own hay, your costs are lower; if everything is bought in, they run 20–30% higher. The point isn't the exact sums — it's that without these five numbers, a farm has no way of knowing whether it's making money or not.
Where the money goes: expense breakdown
Shares from our example:
| Item | Amount | Share |
|---|---|---|
| Feed | 70.0 mln sum | 57% |
| Labor | 33.6 mln sum | 27% |
| Buying animals | 6.5 mln sum | 5% |
| Vet care and medicine | 6.5 mln sum | 5% |
| Other | 6.5 mln sum | 5% |
What to do with this:
- Feed is over half of costs, and that's normal for sheep farming. If the share is noticeably higher, don't look at the price of a sack of feed — look at the cost per kilogram of gain: the feed is usually going to animals that have already stopped growing.
- Vet care and medicine at around 5% is a healthy share. When this line is almost nonexistent, that's not savings — a single outbreak in an unvaccinated flock costs more than years of treatments.
- In a year when you're buying in young stock, that line can easily become your single biggest expense. That's fine, as long as you hold to a ceiling purchase price and it pays off in weight gain.
- "Other" above 10% usually means everything is getting dumped into it. Break it out into proper categories — you can't see where the savings are hiding in one big pile.
Before you cut the ration, compare feed prices in listings against your own invoice: often half of the "expensive feed" is simply buying in the wrong season.
The expense breakdown comes straight out of an operations ledger: for those shares to add up on their own, every payment has to be logged with a category and tied to an animal. Our article on tracking farm income and expenses covers how to keep that ledger and what one ram actually costs by it.
Does feed pay off: checking it against weight gain
The fastest efficiency check is comparing the cost of feed with the weight gain over the same period.
Feed cost for the period ÷ weight gain for the period = cost per kilogram of gain.
Example. A fattening group of 30 head, 90 days, a ration of 5,500 sum a day per head:
- feed: 30 × 90 × 5,500 = 14.85 mln sum (≈ $1,240);
- weight gain: 20 kg per head, 600 kg for the group;
- cost per kilogram of gain: 24,750 sum (≈ $2.07).
At a live-weight price of 55,000 sum/kg, the feed pays for itself more than twice over. Now take the same group, but with a gain of only 8 kg per head — common after a rough winter or a worm infestation: 240 kg of gain, cost per kilogram 61,875 sum (≈ $5.18). That's more than the market will pay for it; over 90 days, the farm lost about 1.7 mln sum (≈ $138) on that one group alone.
A working threshold: keep an animal as long as a kilogram of gain costs less than 70% of the live-weight price per kilogram — at 55,000 sum, that's 38,500 sum. For a detailed breakdown by fattening phase, see “How much a kilogram of weight gain costs”.
The key point here is that both numbers — money spent on feed and kilograms of gain — have to cover the same period and the same group of animals. That's exactly where records most often don't line up.
What a notebook can track — and what it can't
A notebook is great for capturing the raw entries: sold, bought, spent — written down the same day, right in the pen, no phone or internet needed. For a farm of 20–30 head, that's enough, and there's no point setting up a system for it.
Where a notebook breaks down is at reconciliation. To get profit for a quarter, you have to flip through three months of entries, add up the income, add up the expenses, sort them into categories, and divide by a headcount that kept changing over those three months. That's an hour of work — which is why it gets done once a year, if it gets done at all.
Excel does the math for you — that's its strength. It has two weak spots. The file sits at home on a computer, while expenses happen at the bazaar and out in the field; by evening, half the small stuff is forgotten, and "other" ends up eating a third of the expense breakdown. And weight gain usually doesn't live in the same file: weights are recorded separately from money, and cost per kilogram of gain needs both. As long as the numbers sit in different places, the feed payoff check never actually gets done.
How this works in QoyHunter
Analytics and reports in QoyHunter pull these same calculations from your records on animals, feed and finances. You pick a period — this month, a quarter, a year, or your own range — and every figure and chart recalculates at once.
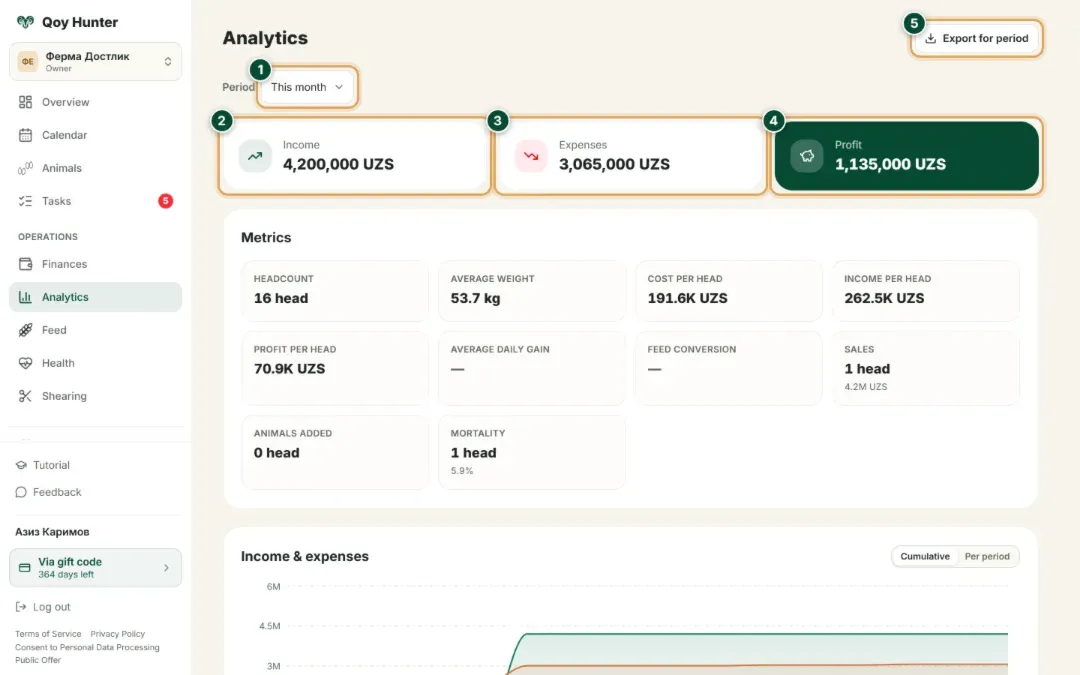
Income, expenses and profit for the period sit right at the top. "Export for period" downloads the report as a file — for your accountant, a bank or a partner.
The "Key metrics" block is exactly the set of numbers our example above was built to produce.
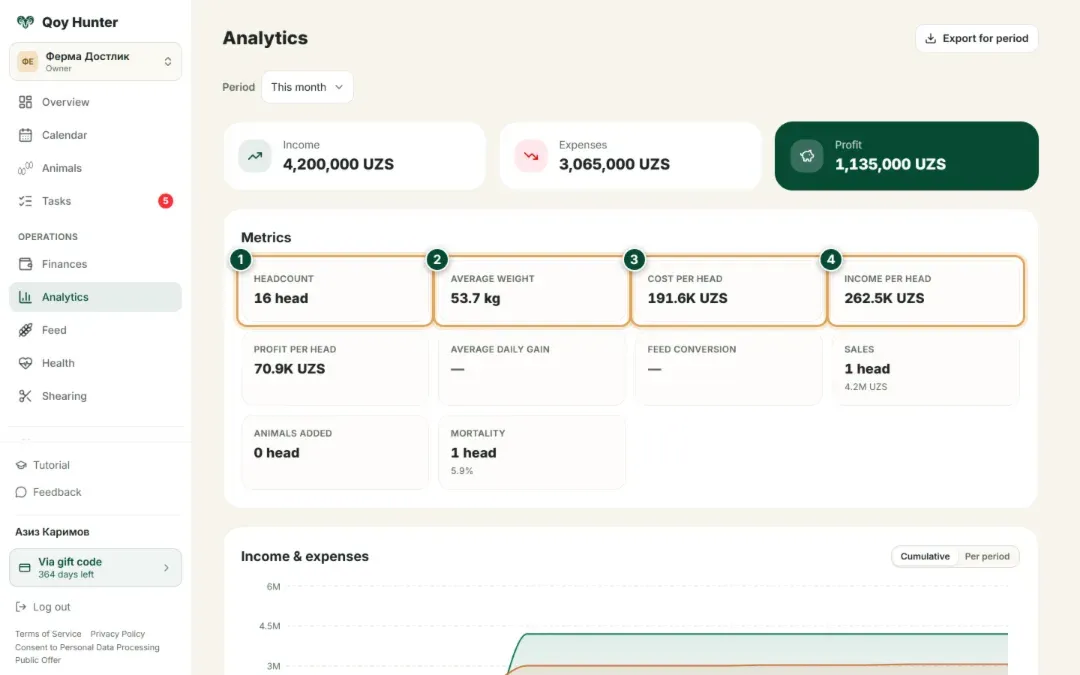
Headcount at the end of the period, the average weight of one animal, cost per head and income per head — together they answer the question of whether the farm is making money.
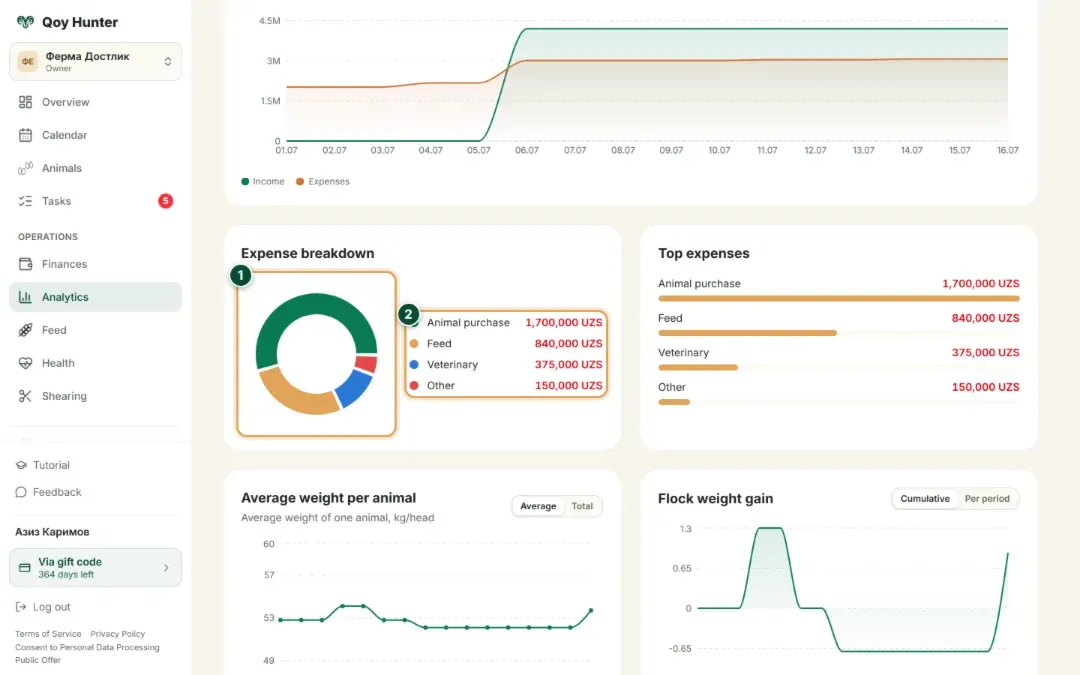
The expense breakdown shows the shares of feed, vet care, medicine and buying animals, and next to it, the same categories in amounts, from biggest to smallest. That's your map for where to look to cut cost per head.
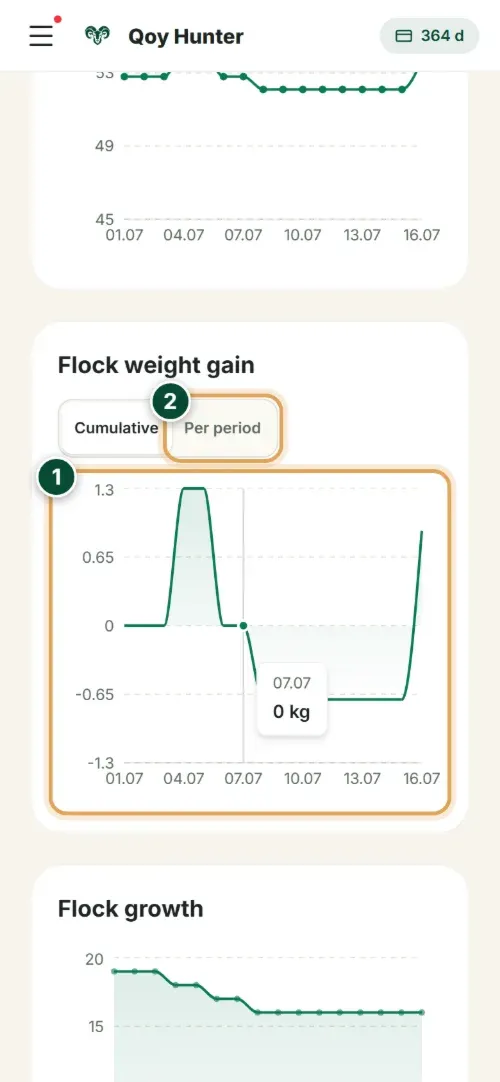
The flock-gain chart shows how many kilograms the herd added — next to feed expenses for the same period, that's the payoff check right there. The "Cumulative" / "Per period" toggle shows either a running total or the gain for each individual day. The screens open on a phone, so you can check the report right where the flock is standing.
To be upfront about access: advanced analytics is available on paid plans. On the farm accounting software plans, the free plan is 0 sum for farms of up to 30 animals, and the "Pro" plan with finances and analytics is about 49,000 sum a month (≈ $4) for up to 500 animals. Prices on the site are marked as estimates.
FAQ
How often should you calculate a farm's profit?
Once a month — to catch expenses creeping up in time — and once a year, to see the overall result. A monthly tally in sheep farming naturally jumps around: in a sales month, profit is high; in a winter-feeding month, it goes negative, and that's normal. What matters is the cumulative total since the start of the year.
What counts as cost if the feed is your own?
The market price of that same feed — not zero. Your own hay could be sold instead: if you fed out 10 tonnes of alfalfa hay at 1,100 sum per kilogram, the farm spent 11 mln sum (≈ $920) — just not in cash. Otherwise your cost per head comes out understated, and you'll think a fattening operation is profitable when it would actually run at a loss on bought-in feed.
Should you count your own labor as an expense?
If you want to know whether this is a business or self-employment — yes, at the going rate for a hired shepherd in your district. Profit after deducting your own wage is what the farm actually earns as an enterprise. For a family farm, you can track both figures: "profit as is" and "profit minus family labor."
How can you quickly tell if feed is paying off right now?
Divide the money spent on feed for a period by the weight gain over that same period. Compare the resulting cost per kilogram of gain with the market price of a kilogram of live weight: as long as it's below 70% of the market price, feeding is worth it. If it comes out higher, it's time to sell the animals, not keep feeding them.
Do you have to pay for software to keep records like this?
No. Everything described above can be calculated in a notebook or in Excel — it's only a question of time and discipline. Software becomes worth it once you have so many events that manual reconciliation stops happening: then the numbers pull themselves together from records you're entering anyway. Farms with up to 30 animals get a free plan in QoyHunter; finances and analytics are on the paid tier.
Manage your flock in QoyHunterCRM for sheep farmers: livestock, health, weighing, finance and analytics — in the app and a Telegram bot.All features →